
Inspecting Usage and Quotas - a How To guide
Project summary
The best starting point to find out about the usage and costs of your projects is the Settings page.
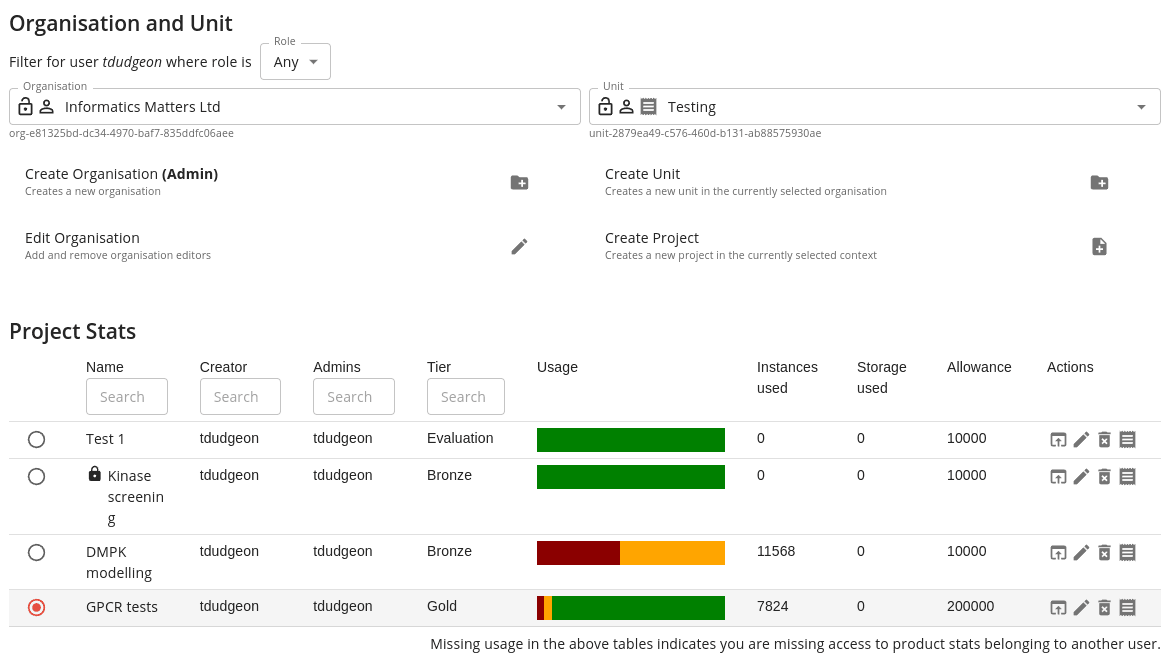
This lets you look at all the projects in a particular using and see a high level summary of the usage stats. You will see information for:
- Whether the project is public or private
- The project creator and administrators
- The project tier (evaluation, bronze, silver or gold)
- A bar graph showing usage costs (see below for an explanation)
- The number of instances used
- The amount of storage used
- The allowance (quota) in coins for your project
- Actions for performing various operation on the project
The usage bar shows your consumption in Squonk coins (or coins for short) and is colour coded as follows:
- Dark red - coins consumed by executing jobs and applications
- Light red - coins consumed storage
- Amber - coins predicted to be used by the end of the month based on your current amount of storage
- Green - coins predicted not to be consumed till the end of the month, assuming your storage does not change and you run no more applications or jobs.
If you move the mouse over one of these bar graphs then a more detailed listing of that usage is presented.
Project charges
The last icon in the list of actions in the project display allows you to open a detailed listing on the charges for a project. Charges accumulate over a period of a month (the billing period).
This is broken down into two sections, the first for processing charges (e.g. applications and jobs) the second for storage (assessed on a daily basis). Information is presented monthly, allowing you to select the billing month you are interested in.
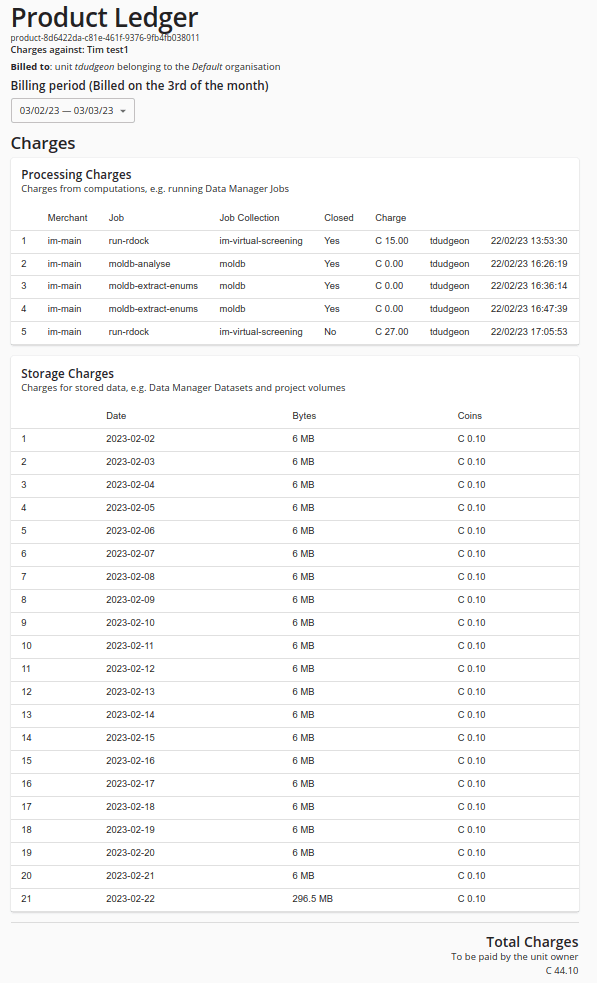
Note in particular the Charge column in the Processing Charges table. This shows the cost of your jobs and applications. You will see that not all have an associated cost.
You can also see a summary of charges for all your projects by clicking on the Product link in the footer. Note: the term product relates to the Account Server - a Data Manager Project is created as an Account Server product, though the distinction is not that relevant for normal users.
After clicking that link you see a table showing all your projects and allowing you to drill down into any of them. You also see a table showing any Dataset Subscriptions that you might have.