CATEGORY
Visual
SOURCE
Squonk
DESCRIPTION
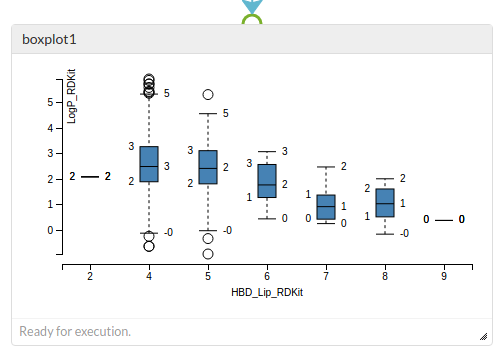
Displays data as a box plot using the D3 Javascript library
INPUTS
Dataset
OUTPUTS
OPTIONS
| Grouping field | The field from the input that is to be used to group the data |
| Values field | The field from the input who’s values are aggregated |
ADDITIONAL INFO