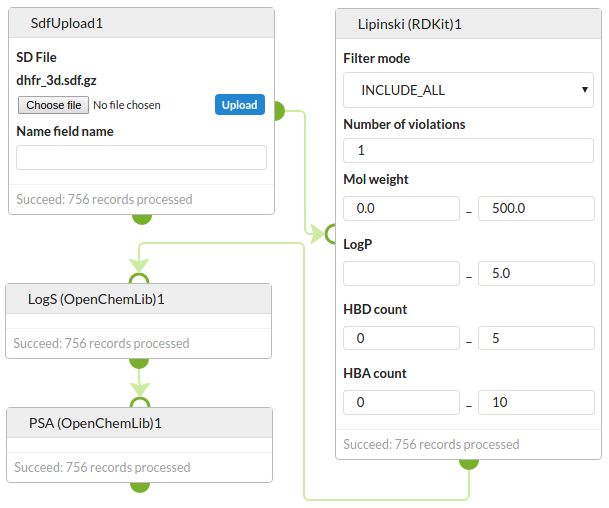
Molecular property prediction
Predict properties of a set of DHFR inhibitors. First predict the Lipinski properties using RDKit and then predict solubility and PSA using OpenChemLib.
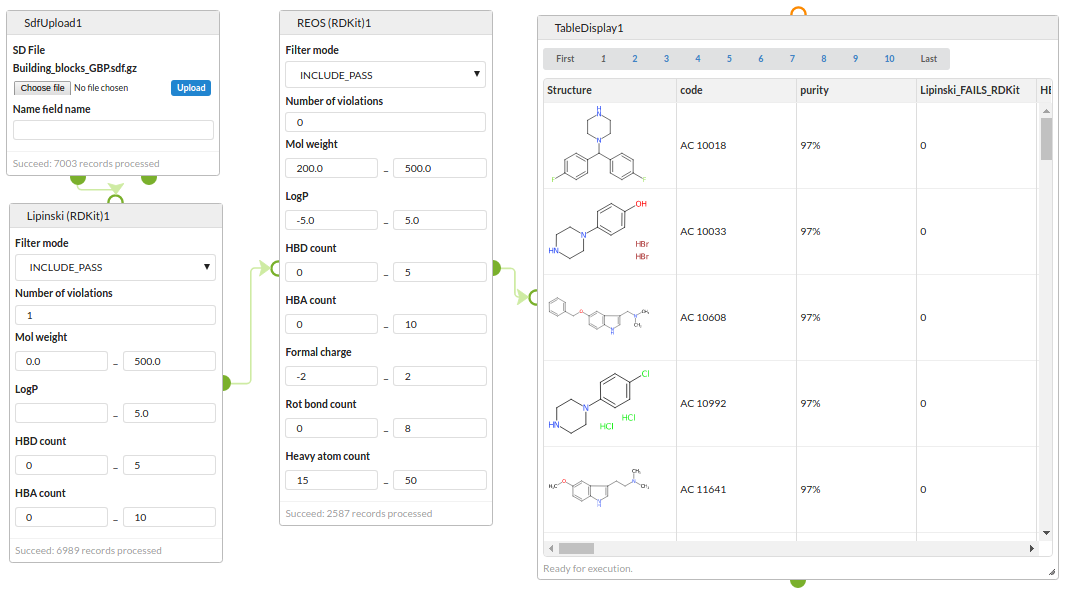
Structure filters
Start with an SDF of building blocks, filter with a Lipinski rule-of-5 filter and then with a REOS filter and view the surviving structures.
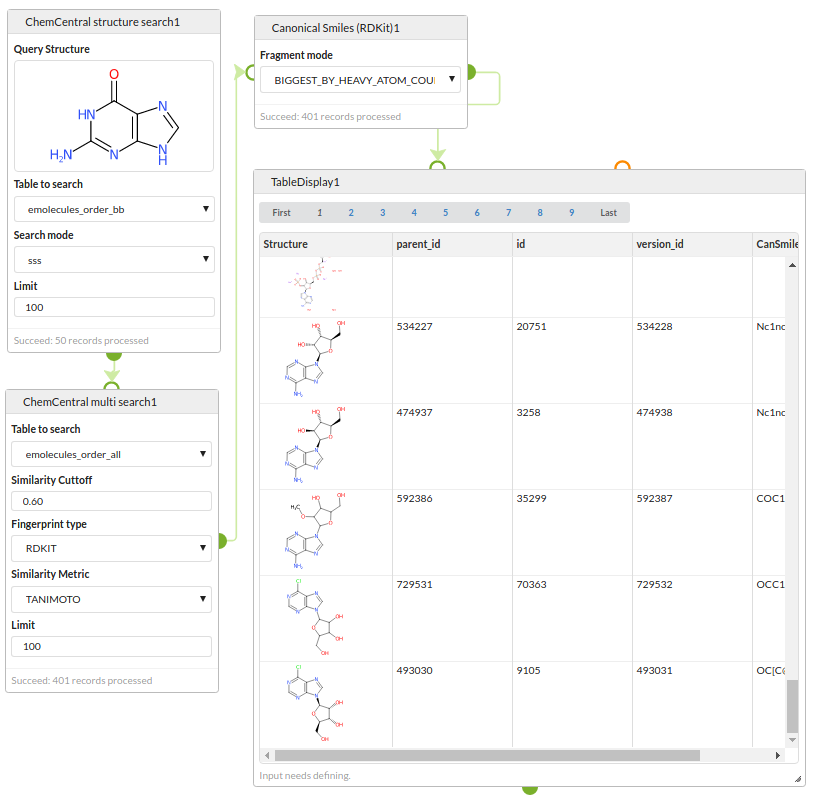
Chemical database search
Run a two stage search strategy against chemical databases stored in a PostgreSQL database using the RDKit cartridge.
Step 1: search the eMolecules database for structures containing a guanine substructure.
Step 2: search the eMolecules database for structures similar to any of the results of the first search
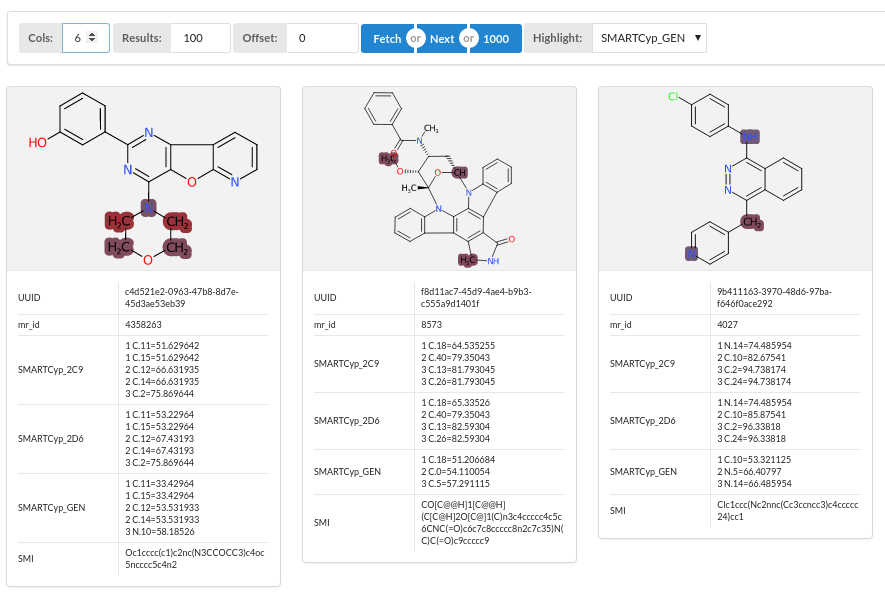
Prediction of metabolism and toxicology
Having already run a prediction of metabolised sites using the SmartCYP program, view the predicted sites with the results viewer.
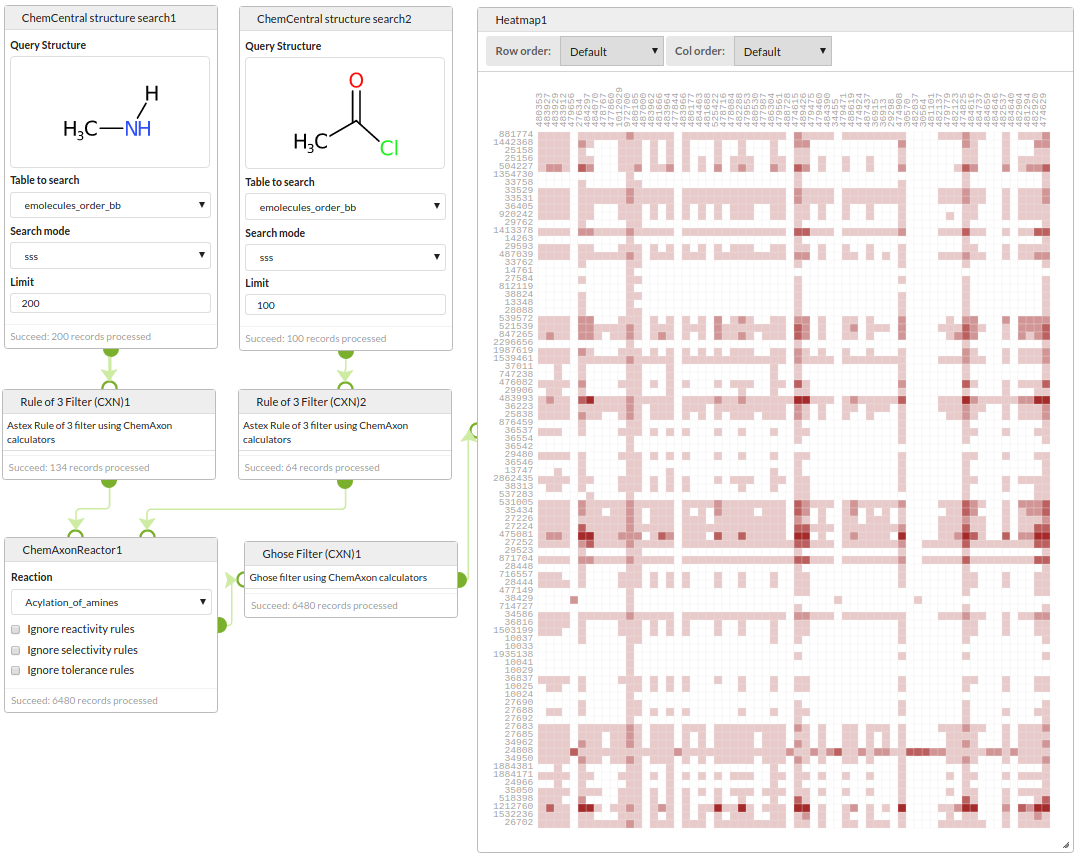
Combinatorial library generation
Start by querying a building blocks database for amines and acid chlorides, filter those reactants with a rule-of-3 filter, enumerate the library with ChemAxon's Reactor, filter the products with a Ghose filter and visualise the array showing the mumber of failures of the Ghose filter for each product.
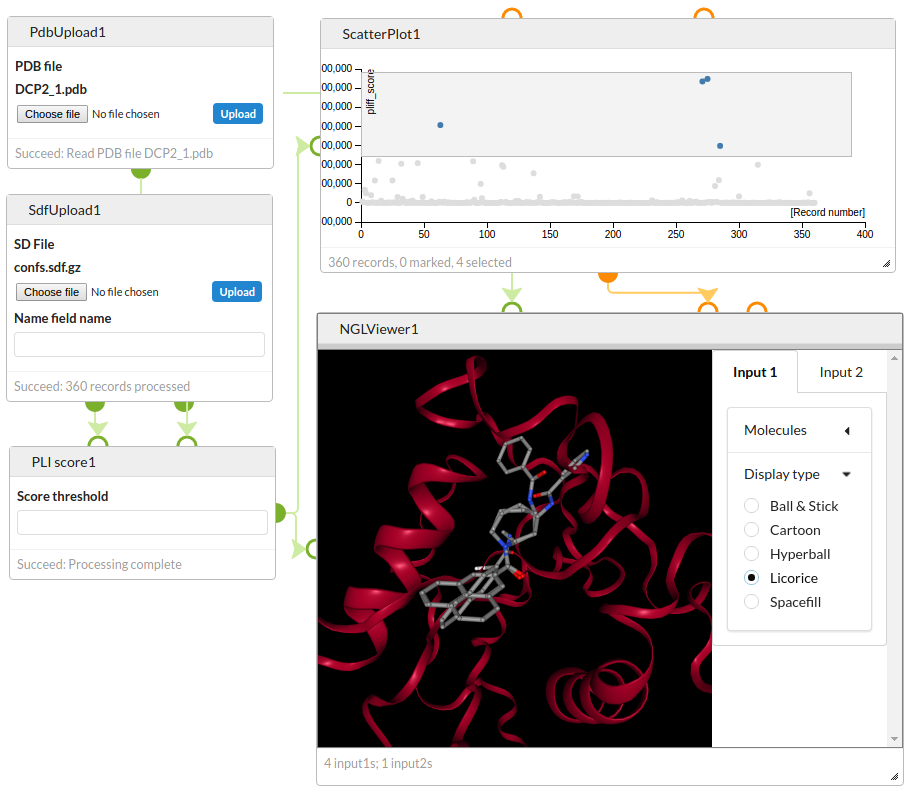
Ligand and target based virtual screening
Score a set of previously generated active site conformations with the Astex PLI scoring function and visualise the best scoring structures with the NGL Viewer.
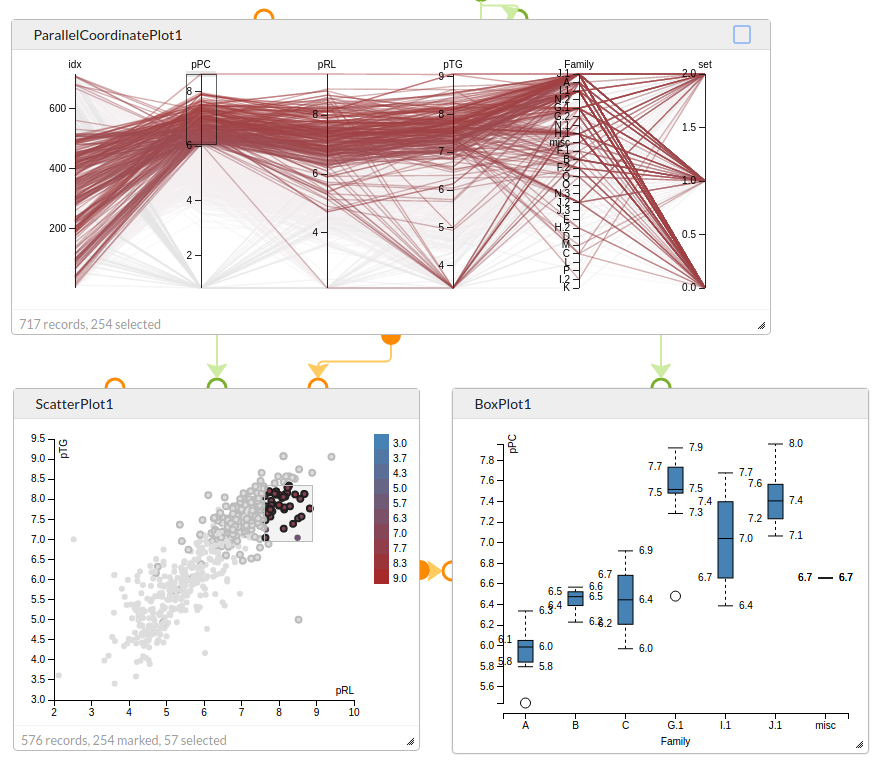
Data visualisation and analysis
Explore data with interconnected charts. Selection of points in the Parallel Coordinate Plot marks those values in the Scatter Plot, and the selected points in the Scatter Plot are used to generate data for the Box Plot that shows the distribution of activities across the different chemical families.
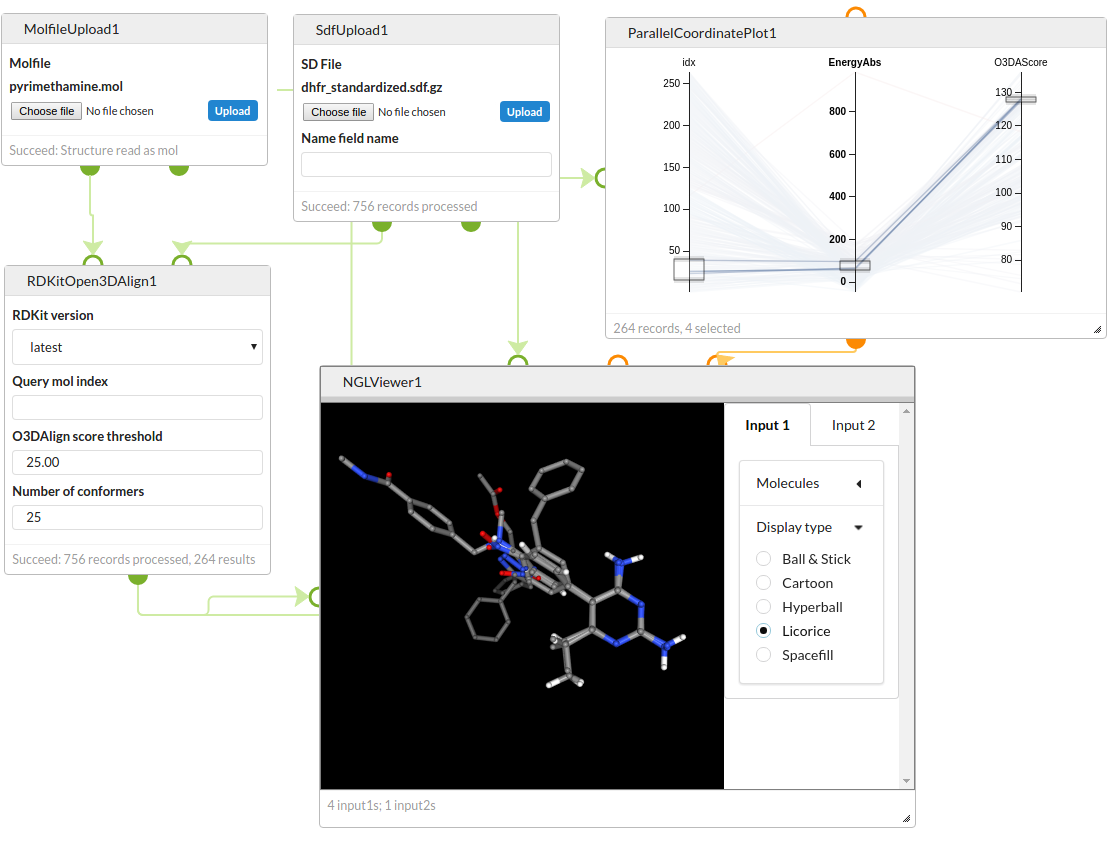
3D conformer generation and analysis
Generate conformers for a set of DHFR inhibitors and use Open3DAlign to align them to a target structure. Filter the results by the energy of the conformer and the alignment score and view the overlays using the NGL Viewer.
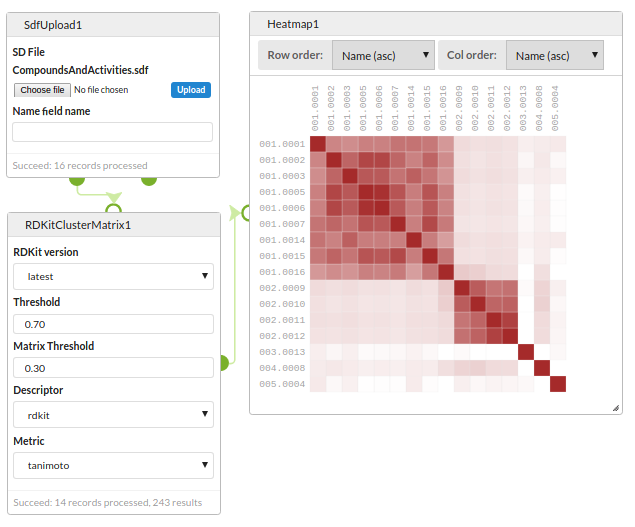
Clustering and diversity analysis
Compare a set of structures for similary and view using a Heatmap.
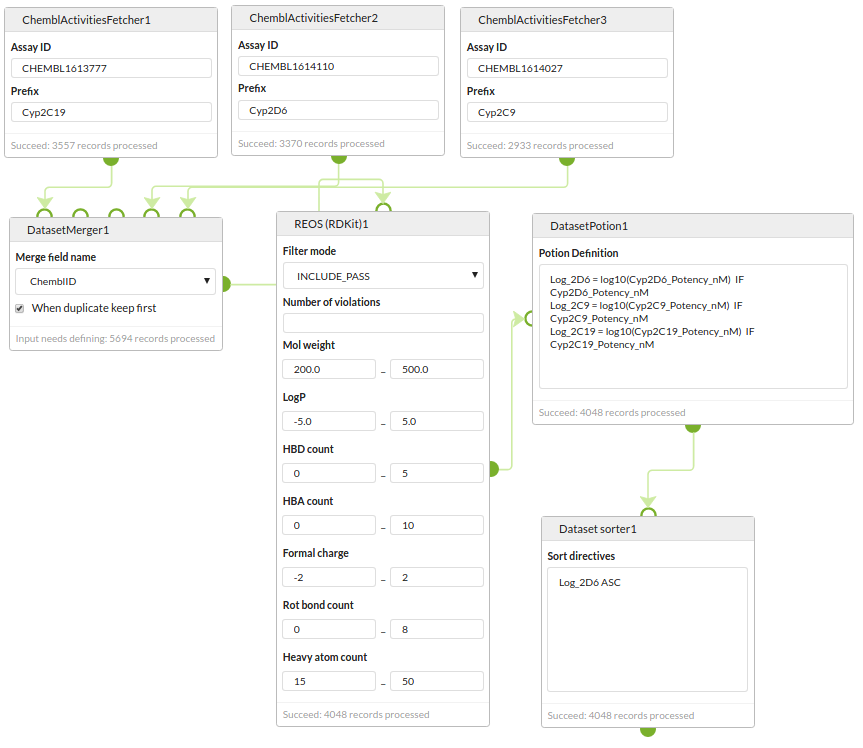
Data curation
Retrieve datasets for three different assays from the ChEMBL REST web servcies, merge them into a single dataset, apply a REOS filter, convert the IC50s to pIC50s and sort by the activity of one of the assays.