CATEGORY
Visual
SOURCE
Squonk
DESCRIPTION
Display of relationships between data using a heatmap
INPUTS
A dataset
OUTPUTS
OPTIONS
| Rows field | The field for the heatmap rows (each discrete value is a row) |
| Columns field | The field for the heatmap columns (each discrete value is a column) |
| Values field | The field for the heatmap values that are displayed in the cells |
| Collector function | The function used to collect the values (see below) |
| Cell size | The size (in pixels) for each cell |
| Left margin | The size (in pixels) of the left margin (may need adjusting to accommodate large row labels) |
| Top margin | The size (in pixels) of the top margin (may need adjusting to accommodate large column labels) |
ADDITIONAL INFO
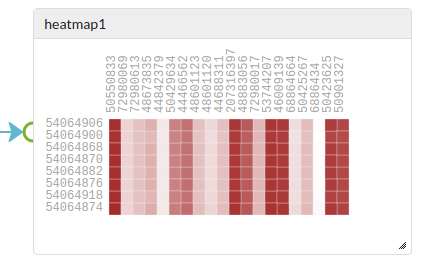
A heatmap is a powerful and flexible way to display relation between two sets of data. The value of each relation is displayed as a cell in a 2D matrix with the colour indicating the value. As such it has many potential uses, including displaying information for a combinatorial library and for showing similarity within a set of structures,
The current heatmap implementation is very much an early version, and much more is planned to be done to improve it.
Collector function
To use it you need to understand the idea of “collecting values”. The input is a dataset with each record containing various values (fields). You need to select one field to be the rows and another to be the columns (potentially these can be the same field). The discrete values of each of these fields become the row and column headings. The fields must be categorical in nature (e.g a finite set of strings or integer numbers). You also select a field whose values are to be displayed in each cell. Typically these are numbers. Effectively a 2D pivot of the data from the values field is performed using the row and column fields as the pivots. Depending on the data each cell can potentially contain zero or many values, but often there would only be a single value. This is where the collector function comes in to play. It defines how to handles these (potentially) multiple values. The current collect functions that are supported are:
- Count - return the number of pivoted values in that cell. The values themselves are ignored, only the number of them is releavant. This is the only function that can be used if your values field is not a numeric field.
- Sum - return the sum of all values
- Average - return the average of all values
- First - return the first value encountered
- Last - return the last value encountered
In cases where there is never more than one value then Sum, Average, Fist and Last would all return the same value.
Layout
Also to note is the settings for the left and top margins. The heatmap is a bit different from other cells in that its dimensions are strongly affecting by the number for row and columns and by the length of the row and column text values. As such its very difficult to automatically layout the heatmap. To accommodate this you can change the left and top margins once you see the size of the row and column labels. Similarly you can resize the cell once you see its overall dimensions, though the size of the cells also can be adjusted. Where the heatmap if too big for the cell scroll bars appear.
Sorting
The heatmap rows and columns can be sorted. Click on a row or column heading to sort by that row/columns values. Further sorting options will appear soon
Selection
Cells of the heatmap can be selected by dragging out an area with the mouse. In future this selection will be propagatable to other cells.