CATEGORY
Visual
SOURCE
Squonk
DESCRIPTION
Display and filter data using a parallel coordinate plot
INPUTS
A dataset
OUTPUTS
OPTIONS
| Include fields | The fields to include in the plot. Choose only numeric or categorical field types |
ADDITIONAL INFO
This is a powerful way to visualise data and spot correlations between fields.
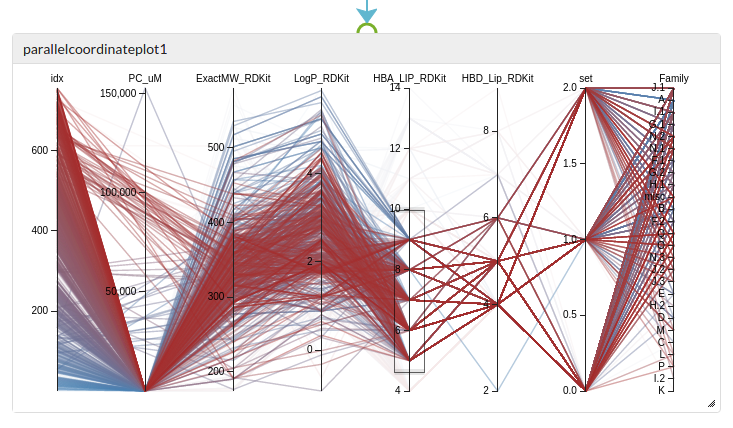
Data for each record is displayed as a path through the different vertical axes, intersecting with each axis at the value for that record.
Functions available
Brushing: drag out a region along each vertical axis to “brush” (or select) the records with values within those limits. Brushes can be set on multiple axes, selecting only records that pass through all the brushed regions. This provides a powerful but simple way to graphically filter data.
Coloring: the lines are coloured from steel-blue to brown according to one of the fields. Click on an axis heading to re-colour according to that property.
Reverse axis: Double click on an axis title to reverse the direction of the axis.
Re-ordering: drag an axis to a new location to re-order the fields. This lets you better see correlations between fields.
Known bugs and limitations
- Configuration such as brushes, the order of the axes, the direction of each axis are not saved and lost when the plot is re-displayed. We plan to resolve all these issues.
- The plot does not re-size correctly in the vertical direction. To get it to do so your must re-execute the cell once resized. This appears to be a bug in the underlying Javascript components that we are trying to resolve.
Planned enhancements
- Allow the brushed data (the selection) to be propagated as a filter to downstream cells
- Allow input data to be marked and/or filtered using the selection of another cell
- Ability to configure axis details e.g. specify a log scale