CATEGORY
Molecular Properties
SOURCE
Academic Open Source
DESCRIPTION
SMARTCyp metabolic site prediction
INPUTS
A dataset of molecules
OUTPUTS
A dataset of molecules
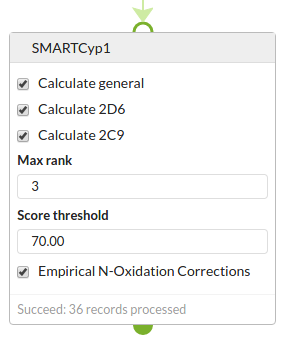
OPTIONS
| Calculate General | Perform the general P450 calculation |
| Calculate 2D6 | Perform the Cyp 2D6 specific calculation |
| Calculate 2C9 | Perform the Cyp 2C9 specific calculation |
| Max rank | Max rank to report (ties possible). Default 3. |
| Score threshold | Max score to report. Default 100. |
| Empirical N-Oxidation corrections | Apply empirical Nitrogen Oxidation corrections. Default true. |
ADDITIONAL INFO
SMARTCyp is a tool from the University of Copenhagen (described in papers that can be found here) that predicts the atoms that are metabolised by Cytochrome P450 enzymes. It can be used to give a guide to whether your molecules might be rapidly metabolised. The methodology is described here and here.
The SMARTCyp calculation is slower than many other molecular predictions, and most suited to small numbers (10’s or 100’s) of molecules.
Squonk’s implementation of SMARTCyp
Our implementation is based on the Java source code provided by the University of Copenhagen. We have adapted it slightly to function as a Squonk service, but there are no material changes to the algorithm and the results should be identical to those generated by the SMARTCyp web site or download versions.
One enhancement we do make is related to structures with multiple fragments. The University of Copenhagen implementation breaks the structure into fragments and keeps the largest fragment and outputs results for just that largest fragment. The Squonk implementation also calculates scores only for the largest fragment, but maps those scores back to the original structure, thus not changing the original structure in any way.
SMARTCyp uses an old version of CDK (version 1.4.8) in its implementation. Squonk’s SMARTCyp implementation also uses this version to ensure reproducibility of results. How this means that there is a small possibility that molecules handled by other CDK based processes (using a newer version of CDK) may not be handled correctly by the SMARTCyp cell (e.g. if there are bugs or changes in how molecules are represented between the CDK versions).
How to use the SMARTCyp cell
The options have 3 types:
- Which Cyp calculations to perform. There is a general calculation and more specific ones for Cyps 2D6 and 2C9. Choose which ones you want.
- Options controlling the output.
- You can specify the score threshold (atoms with lower scores are predicted to be more rapidly metabolised). The default is 100 which is fairly promiscuous, and you might want a more specific threshold to reduce the output.
- You can specify a maximum rank to report. The most strongly metabolised atom(s) are rank 1, the next most metabolised rank 2 etc. There can be ties, which are almost always due to equivalence of atoms due to symmetry.
- Options controlling the calculation
- Apply the N-oxidation correction (see here)
How to view the results
Results (and metadata) are added as normal fields to the dataset, one field for each of the three Cyp calculations.
The best way to view the results is using the results viewer. Click on the Expand icon in the cell titlebar to open the Results Viewer. You will see the result fields displayed, including the rank, score and atom number.
To get a more visual representation change the highlighter (default is None) to one of the SMARTCyp generated fields. The atoms that are predicted to be metabolised are highlighted using a colour that represent the score. The colour scale used is a fixed scale suitable for SMARTCyp, ranging from 25 (brown colour) to 100 (steel blue colour) so that the redder the highlight the higher the predicted rate of metabolism at that atom.
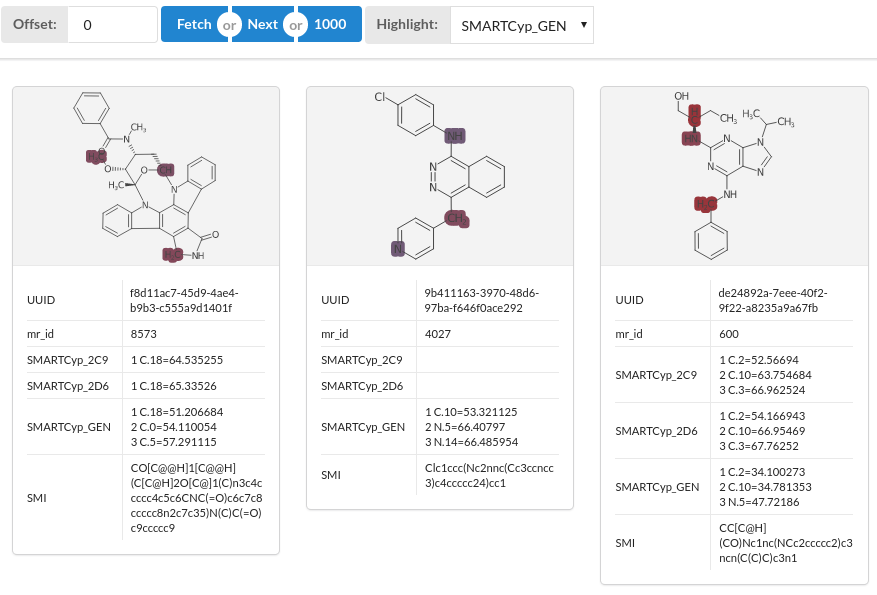
Atom mapping
The highlighting feature uses atom numbers to map the scores to the structures. This means that if the structures are modified then the mapping may become invalid e.g. if the structures are de-salted or have hydrogens added or removed. Consider carefully the order of cells, and preferably have the SMARTCyp at the end of the process. When using the Results Viewer the output of the SMARTCyp cell will always be correct.