CATEGORY
Visual
SOURCE
Squonk
DESCRIPTION
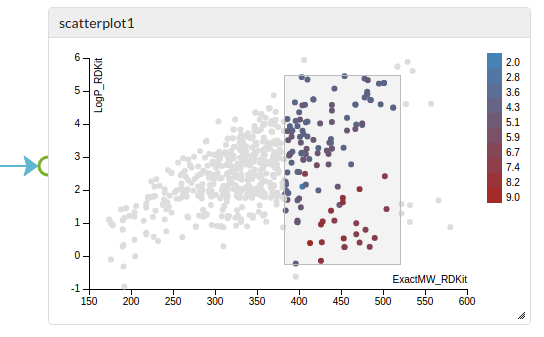
Displays data as a scatter plot using the D3 Javascript library
INPUTS
This cell accepts a dataset as its only input.
OUTPUTS
This cell currently has no outputs.
OPTIONS
| X axis field | The field to use for the X-axis values |
| Y axis field | The field to use for the Y-axis values |
| Color | The optional field to use for point coloring |
| Point size | The size of the point in the plot (ranging from smallest to largest) |
| Show axis labels | Allows to hide the axis labels to free up some space |
ADDITIONAL INFO
Scatter plot cell allows to visualise data and look for trends and correlations. The example below shows how Lipinski properties can be visualised.
Known bugs and limitations
- Configuration of the brushes is not saved and lost when the plot is re-displayed. We plan to resolve all these issues.
Planned enhancements
- Allow the brushed data (the selection) to be propagated as a filter to downstream cells
- Allow input data to be marked and/or filtered using the selection of another cell
- Ability to configure axis details e.g. specify a log scale
- Specify point size from a variable
- Logarithmic axes