Results viewer is a component that lets you view and manage a cell’s output. It’s available from the cell’s expanded view. The exact capabilities depends on the type of the output. The most common type of output is a Dataset of MoleculeObjects (see here for a description of what these are).
Viewer for Dataset of MoleculeObjects
This viewer has three tabs:
- Results
- Metadata
- Export
Results Tab
This tab let’s you see the actual results, including the structure and its properties. A toolbar at the top let’s you control the display.
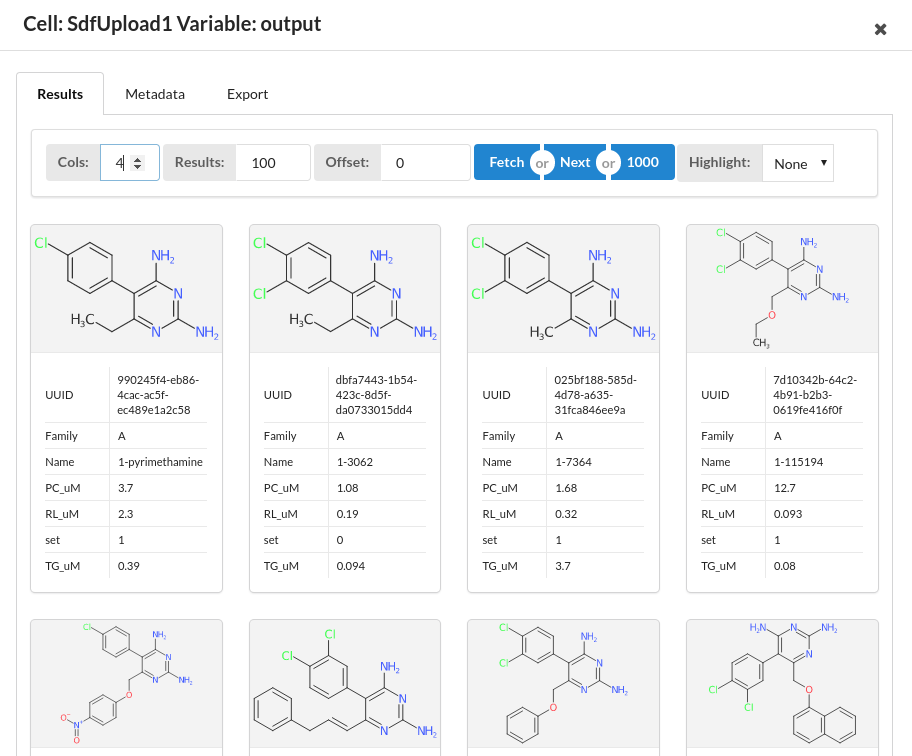
Each record is displayed as a ‘card’ with the structure at the top, the record’s UUID next and and the properties below (the UUID is a 32 character unique identifier fro the record that will usually be carried through during cell processing). The number of columns in the display can be adjusted using the ‘Cols’ widget in the header. The less columns the bigger the cards. This allows the size to be adjusted according to your needs and the type of data that is displayed, Properties with long values will need more space to display, so will require larger cards.
As this viewer holds the data for all the records that are displayed it is not suitable for viewing large numbers of records at once. As By default the first 100 results are displayed. You can change which records are displayed using the controls in the toolbar. There are two text fields:
- Num results: the is the number of cards that are displayed
- Offset: the number of records skipped
For instance, if Num records is set to 100 and Offset is set to 200 then you will be seeing records 201-300.
You can change the records that are displayed using the next three buttons:
- Fetch: fetch the specified records (limited to a maximum of 1000)
- Next: fetch the next set of records. e.g. if Num records is set to 100 and Offset is set to 200 then clicking Next will set Offset to 300 and you will see records 301-400
- All: Retrieve all data. Note that due to the limitations above this is restricted to a maximum of 1000 records
You will also see a Highlight field. Datasets that contains results that allow highlighting of the structures (such as those that have been processed by the SMARTCyp cell) can use these fields to highlight the structures. Select the appropriate field and you will see the structures highlighted accordingly. See the SMARTCyp cell for an example.
Metadata Tab
This is an important tab that allows you to see the metadata associated with the dataset. This includes properties of the dataset as a whole and properties of individual fields. As a dataset is processed using the notebook’s cells this metadata is automatically recorded.
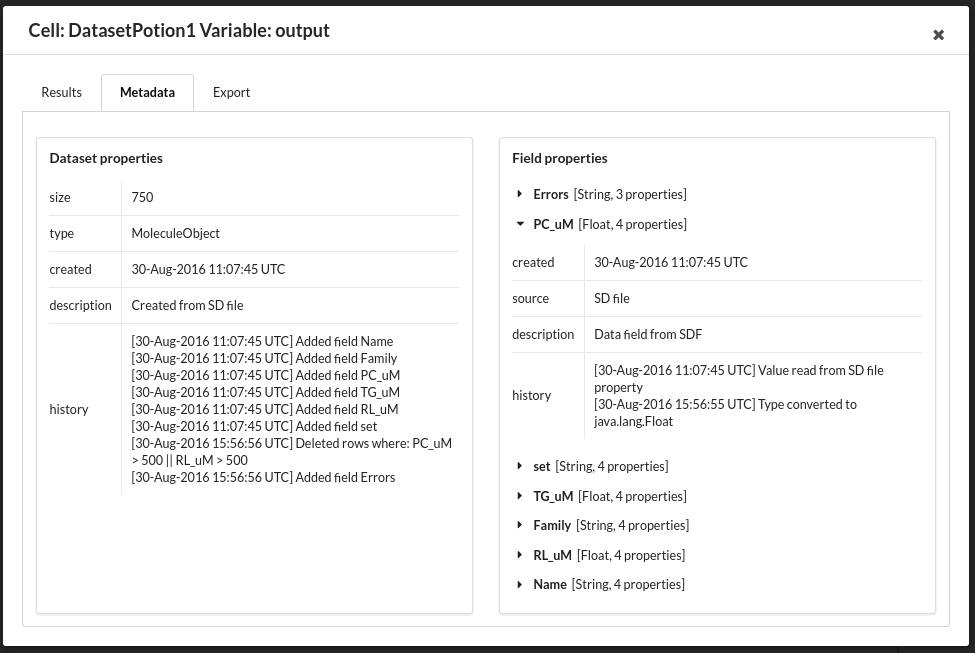
The left hand side of the window shows the dataset properties and the right hand side shows the properties of the individual fields.
Export Tab
This tab allows the dataset to be exported to file in various formats:
- Results in native JSON format
- Metadata in native JSON format
- MDL SD file format
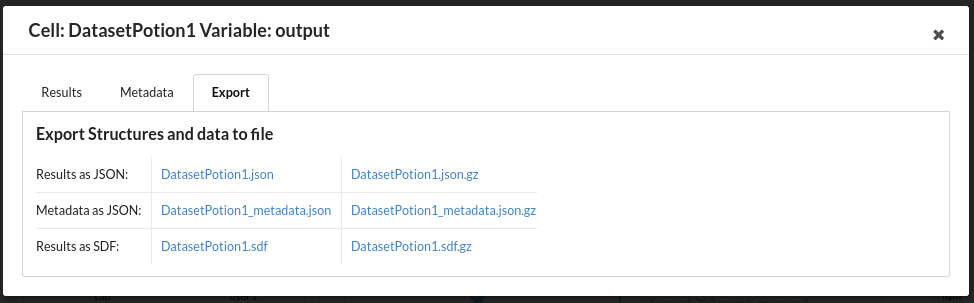
The resulting files are downloaded to your computer where you can use them in other software. In all cases the results can be compressed using gzip to reduce the download time and file sizes.