This is a guide to building workflows in a Notebook.
Data Processing Workflows
Connecting cells
The general data processing workflow can be described as follows
- Add cell to canvas by drag-and-dropping it from the Cell Palette
- Specify cell options
- Execute cell
- View cell output using the Results Viewer
- Add second cell to canvas by drag-and-dropping it from the Cell Palette
- Connect the output of the first cell to the input of the second cell
- Specify the options of the second cell
- Execute the second cell
- View cell output using the Results Viewer
- Continue by adding more cells
The key thing here is that you are building a data processing workflow. Each cell generate output variables which can be used as the input to other cells. The producer - consumer relationships are defined by connecting the green output endpoint of one cell (the producer) to the green input endpoint of another cell (the consumer). One cell’s output can be connected to multiple cells as input, but each input can only have a single connection.
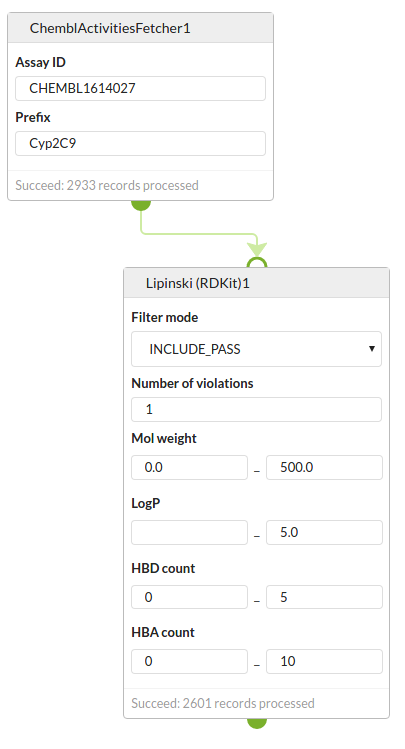
The simple example above shows a ChEMBL fetcher cell that fetches activities and structures from the ChEMBL REST web services and creates an output dataset with 2933 records. This is then used as input to the next cell, one that applies a Lipinski Rule of Five filter resulting in 2601 records passing the filter.
Disconnecting cells
To remove a connection drag the destination end of the connection away from the endpoint to an empty area of the canvas. The Bindings popup editor, which used to be used for this is not longer needed and has been removed.
Configuring Cells
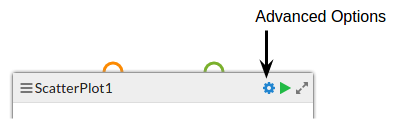
Most cells have options that can be set by the user. These are either set directly in the cell as in the example above, or in some cases are set using the Advanced Options editor which is opened using the icon in the cell title bar.
The main menu bar allows other operations to be performed on cells.
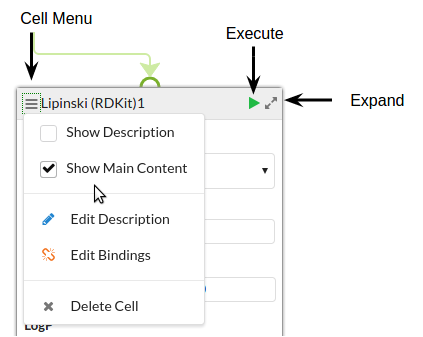
A description panel can be shown or hidden. Similarly, for most cell types, the main content area can be shown or hidden. The description can be edited. These three options allow the display of the cell to be tailored to your needs. Once the options are set the main content area can be hidden to free up space, and if necessary a description of what the cell does can be shown.
Other options allow the bindings to other cells to be edited, and to delete the cell completely.
Visualising results of a Workflow
Results Viewer
Most data processing cells will allow the cell’s output to be viewed with the Results Viewer. Open this by clicking on the Expand icon in the cell’s title bar. This allows you to view the results and metadata, and to export them to files. More details can be found in the Results Viewer page.
Visualisation Cells
Certain cells are designed for visualising and interacting with results. Examples are Table, Scatter Plot and Parallel Coordinate Plot. These cells typically have a data input (green endpoints) but no data output. However they may provide Option endpoints (displayed in orange) that allow options to be propagated, for instance, the selection from one cell being propagated to another cell as a filter. The provides a highly interactive visualisation environment.
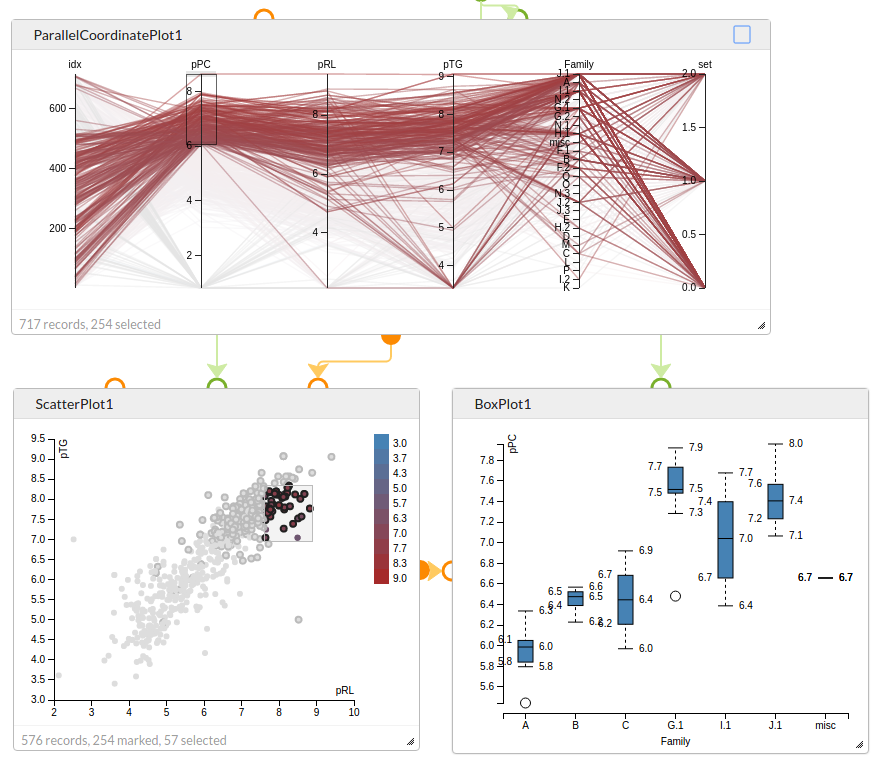
The screenshot above shows the same data fed into a parallel coordinate plot, a scatter plot and a box plot. The selection in the parallel coordinate plot is used to mark point in the scatter plot and the selection in the scatter plot is used to filter the data displayed in the box plot.
To enable this interactive visualisation connect the orange selection option output of one cell to one of the orange option inputs (typically to filter or to mark the data shown in that cell).